Park City Real Estate Statistics / Trends
Carol is Chair of the Park City Board of Realtors Statistics Committee. Statistics are issued quarterly. To receive Statistics Committee updates – Click Here to Sign Up (Email)
 HIGHLIGHTS
Park City real estate activity has rebounded to normal (pre-pandemic) activity, again generally mapping national trends.
- • Gated communities, such as Promontory, show continued robust sales.
- • Homes priced below median typically sell in a quarter of the time of a house priced above median.
- • Median prices in city limits are stable, compared to other areas.
OVERVIEW
The Park City real estate market is extrarodinarily segmented. There are immense, significant differences in trends within our regional segments, and property types.
SALES
The number of sales is again stable year-over-year, although somewhat depressed due to mortgage interest rates. Overall, prices are trending upward, but with some restraint. Political and economic uncertainties also presently cause hesitation in activity.
INVENTORY
Inventory is not as thin and troublesome as a few years ago, with 4.2 months of inventory standing at current activity rates. This remains a bit lower than normal.
PRICING
The median price for all property types is rising, but the point to make on current market valuations is that they are highly segmented. Median and average prices are trending up in all most neighborhoods, although some areas are significantly greater, some lower.
LOOKING FORWARD
Valuations vary widely across property types and locations. The Park City / Deer Valley market remains unusually complex and segmented. We expect this complexity to continue, in an otherwise upward trend. An additional emerging trend which we expect to continue is robust interest in areas outside Park City proper, such as Kimball Junction, Jordanelle, Kamas, Heber City, and Midway.
Park City Real Estate Statistics / Data
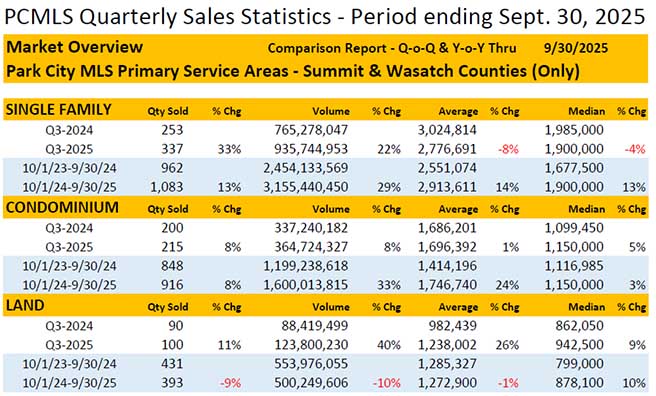
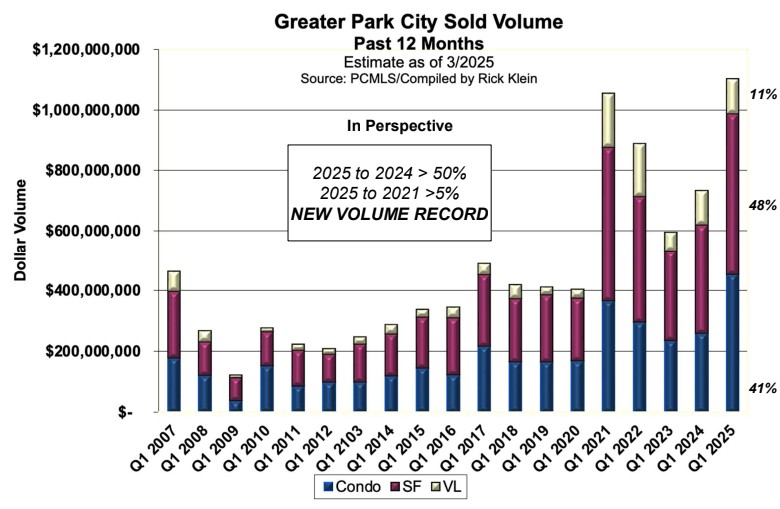
Latest (Quarterly) Charts of the two primary statistical indices of market trend. These provide an overview of the entire Park City region.
Quarterly Year-Year & Annual Overview

Total Number of Sales - Includes ALL properties (Homes, Condos, Lots) in the Park City Area

Total Dollar Volume - Aggregate Real Estate Transactions, Entire Park City Region


